Example Modules
Simple Example
A file containing a few examples of function calls. Line segment intesection, region creation, and region intersection are shown.
-
pyspatiotemporalgeom.examples.test.exampleCreateRandomRegionsAndIntesect()[source]¶ An example that creates two random regions and computes their intersection.
Generating Random Regions
An example script showing how to generate a reandom region. The generated region is stored in hexadecimal format in a text file for portability.
Creating a Moving Region by Interpolating Between Two Regions
Intersection of 3D line segments and traingles
traingleTest.py
example functions using the triangleLibrary.py functions
Computing Temporal Coverage for an Interval Region
-
pyspatiotemporalgeom.examples.tempAggExample.createIntervalRegionUsingRandomRegion()[source]¶ Generates a region from random segments and computes the temporal aggregate as described in:
- McKenney, R. Frye, Z. Benchly, and L. Maughan, Temporal Coverage Aggregates Over Moving Region Streams. IWGS at 22nd ACM SIGSPATIAL I nternational Symposium on Advances in Geographic Information Systems, November 2014, Dallas, TX, USA
returns:
- hsegs
an ordered list of half segments with valid labels.
- A half segment is a tuple with the following:
- ((x,y)(x,y), labelAbove, labelBelow)
labels are integral values
an interior label will be positive. An exterior label will be -1. The side of the hseg on which the interior (exterior) of the region lies will have an interior (exterior) label.
hsegs will be ordered in half segment order
Each cycle in hsegs will have its own unique label number
-
pyspatiotemporalgeom.examples.tempAggExample.createIntervalRegionUsingcreateRegionFromSegs()[source]¶ Computes a temporal aggregate operation on a single interval region. The region is specified within the function, as opposed to a randomly generated segment. See the following for a description of the operation:
- McKenney, R. Frye, Z. Benchly, and L. Maughan, Temporal Coverage Aggregates Over Moving Region Streams. IWGS at 22nd ACM SIGSPATIAL International Symposium on Advances in Geographic Information Systems, November 2014, Dallas, TX, USA
returns:
- hsegs
an ordered list of half segments with valid labels.
A half segment is a tuple with the following: ((x,y)(x,y), labelAbove, labelBelow)
labels are integral values
an interior label will be positive. An exterior label will be -1. The side of the hseg on which the interior (exterior) of the region lies will have an interior (exterior) label.
hsegs will be ordered in half segment order
Each cycle in hsegs will have its own unique label number
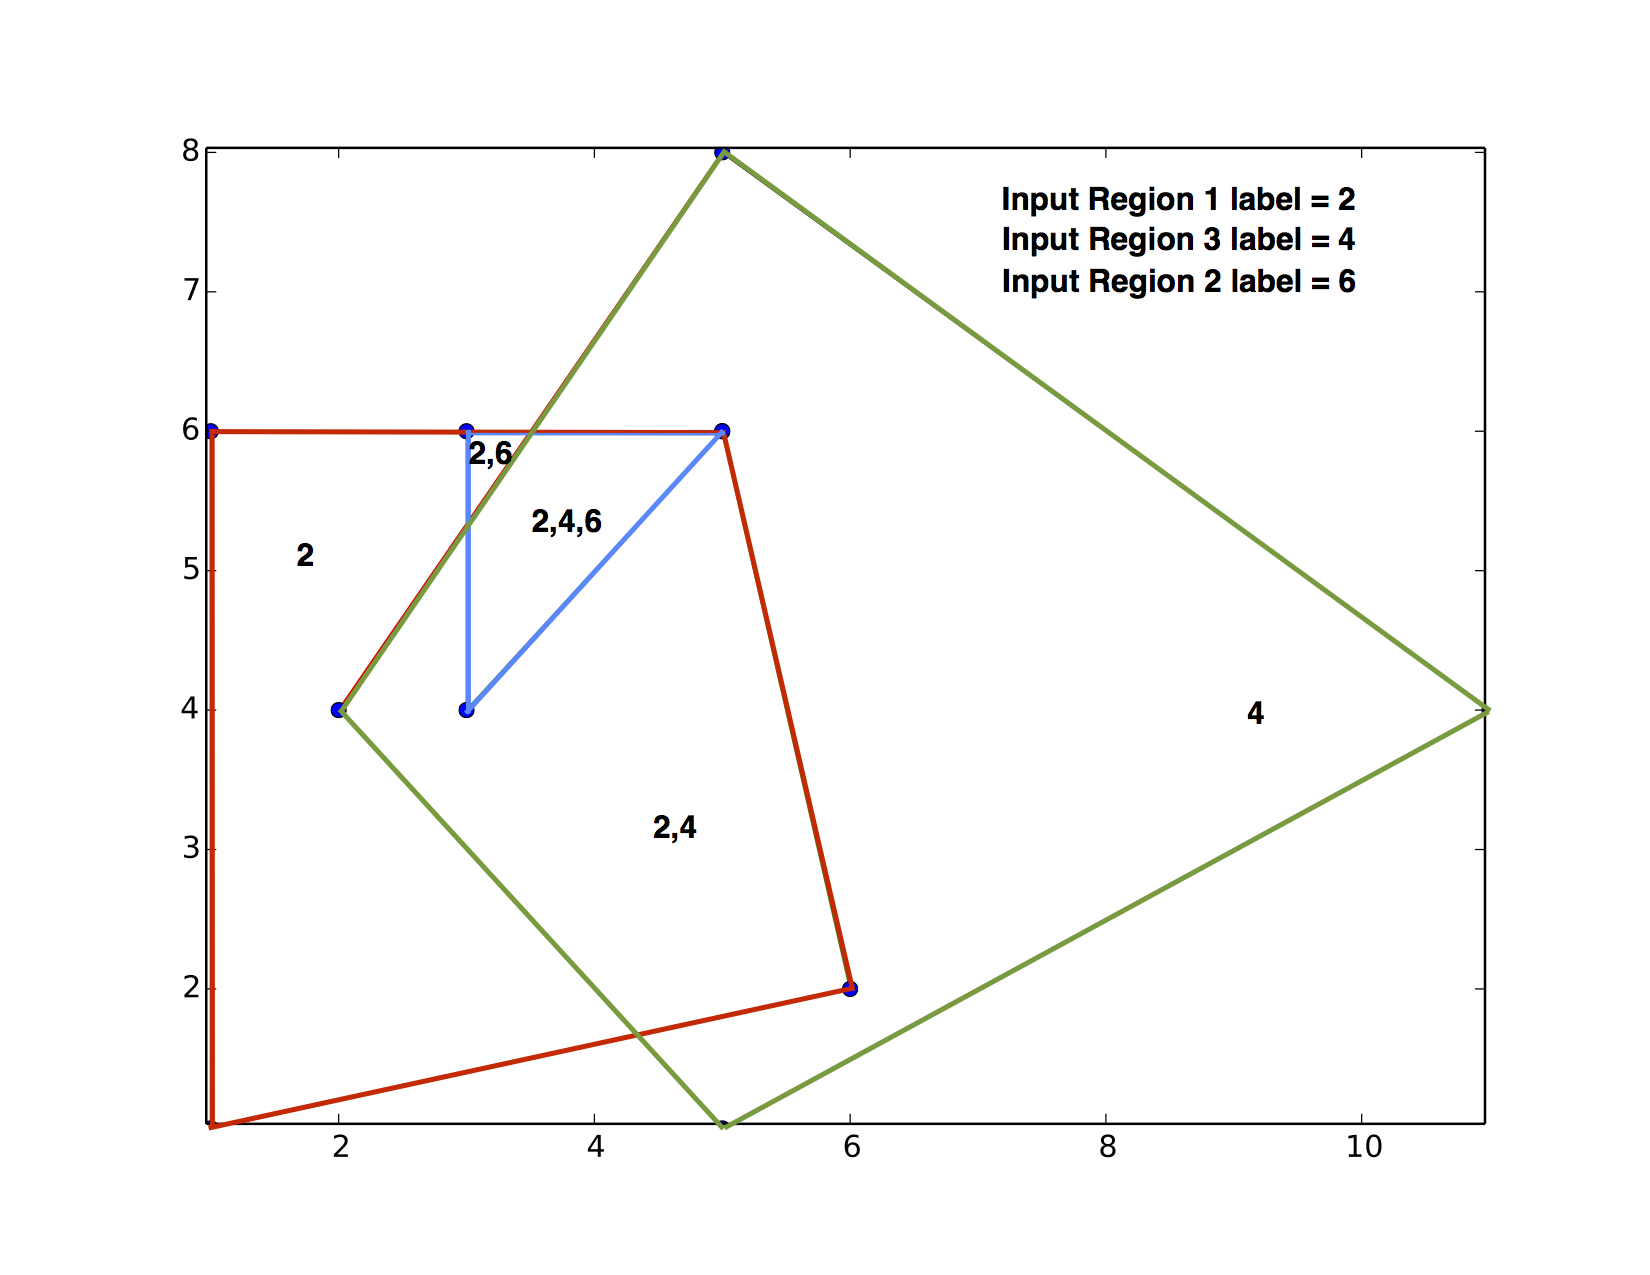
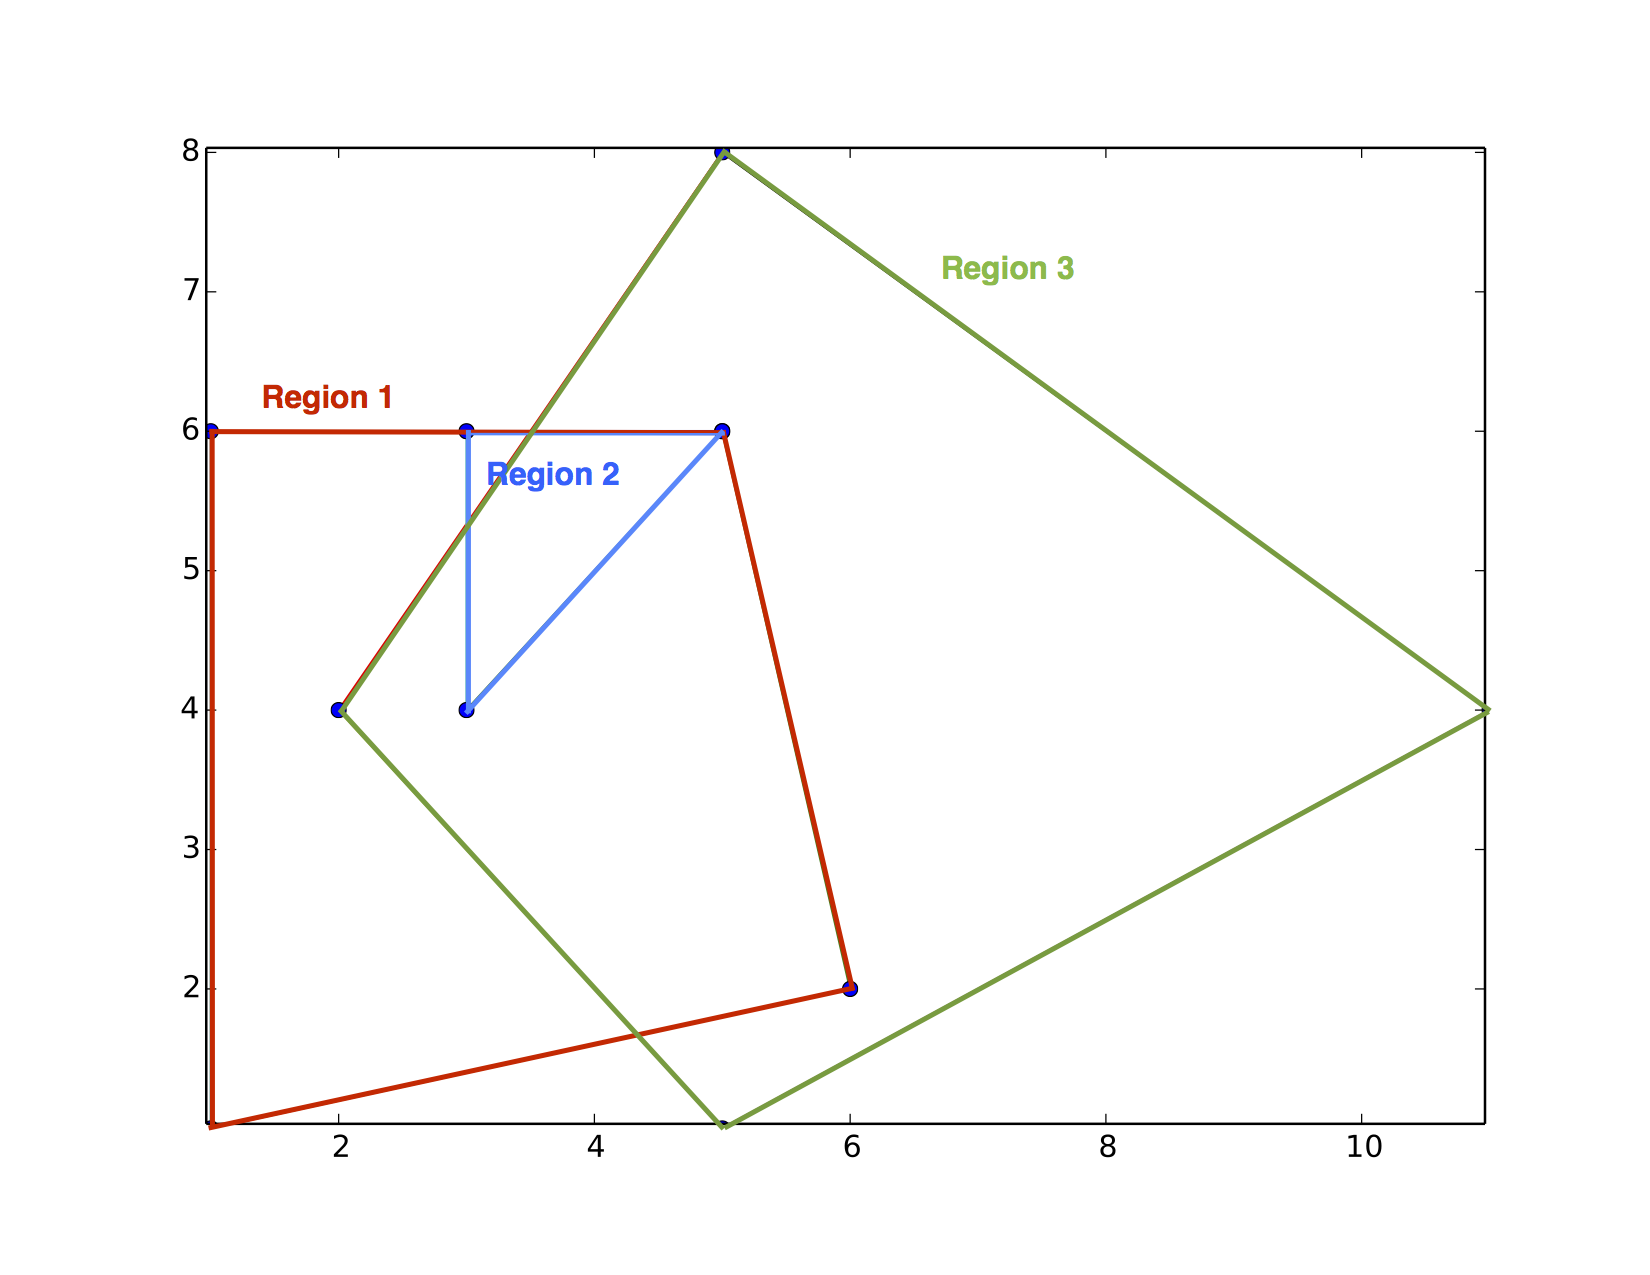
Computing a Map from Input Regions
-
pyspatiotemporalgeom.examples.mapLibraryExamples.createAMapFromSomeCycles()[source]¶ Shows how to create a map from input cycles.
Note that this same functionality can be used to create a map from complex regions without modification.
The example here takes 3 input regions and returns a map such that an area covered by multiple regions carries the labels of ALL input regions that cover it.
At the end of the function, the user is left with a list of segs, a parallel list of above and below labels correspinding to the segs, and a dictionary that maps the end label to a set of input labels.
The regions in this function overlap. the scene looks as follows:
Once the map is created, the labelling occurs as follows: